Quick start
craw_coverage
craw_coverage need a file bam or wig to compute coverage and an annotation file to specify on which regions to compute these coverages.
the -b or –bam allow to specify the path to the bam file.
or alternatively the
-w, –wig option to specify the path to the wig file if the both strand aer encode in same file (negative value are on reverse strand)
–wig-for and –wig-rev to specify the paths to the wig files for the forward and reverse strand respectively
the -a –annot allow to specify the path to the annotation file.
The –bam and –wig options are mutually exclusive but one of these option is required. –wig and –wig-for or –wig-rev are also mutually exclusive. the –annot option is required.
craw_coverage --bam ../WTE1.bam --annot ../annotations.txt --ref-col Position --before 100 --after 500
craw_coverage --wig ../WTE1.wig --annot ../annotations.txt --ref-col Position --before 100 --after 500
craw_coverage --wig-for ../WTE1_forward_strand.wig --wig-rev ../WTE1_reverse_strand.wig --annot ../annotations.txt \
--ref-col Position --before 100 --after 500
Warning
At the same place of bam file, there must be the corresponding index file (the bam.bai file). To generate the .bai file you have to use samtools program:
samtools index file.bam
see http://www.htslib.org/doc/ for more explanation.
with fix window
To compute the coverage on a fix window: we need to specify which column name in the annotation file define the reference position. The window will computed using this reference position.
–ref-col
Note
if –ref-col is omitted craw_coverage will use the column position. If there not “position” column an error will occur.
two ways to determine the window:
with –window option for a window centered on the reference position.
–window define the number of nucleotide to take in account before and after the reference position.
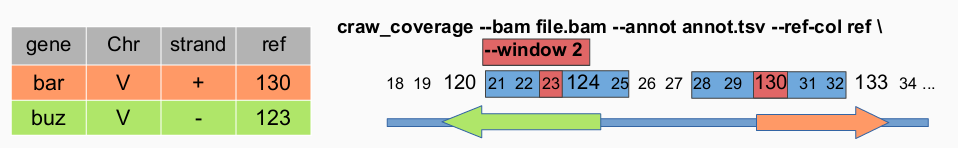
craw_coverage --bam ../WTE1.bam --annot ../annotations.txt --ref-col Position --window 100
This command will compute coverage using WTE1.bam and with annotations.txt file the column used to compute the window is ‘Position’ and the window length will be 100 nucleotide before the reference position and 100 nucleotides after (201 nucleotides length).
With an non centered window we have to specify two options –before and –after
–before BEFORE define the number of nucleotide to take in account before the reference position.
–after AFTER define the number of nucleotide to take in account after the reference position.
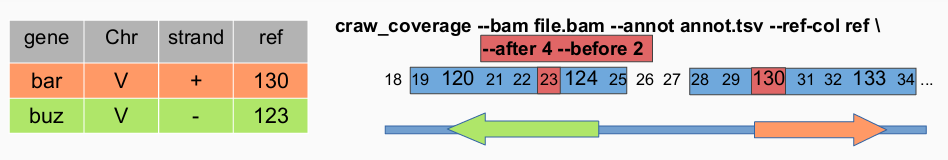
craw_coverage --bam ../WTE1.bam --annot ../annotations.txt --ref-col Position --before 100 --after 500
This command will compute coverage using WTE1.bam and with annotations.txt file the column used to compute the window is ‘Position’ and the window length will be 100 nucleotide before the reference position and 500 nucleotides after (201 nucleotides length).
Note
–after and –before options must be set together and are incompatible with –window option.
with variable window
The regions must be specified in the annotation file.
–start-col COL define the name of the column in annotation file which define the start position of the region to compute.
–stop-col COL define the name of the column in annotation file which define the stop position of the region to compute.
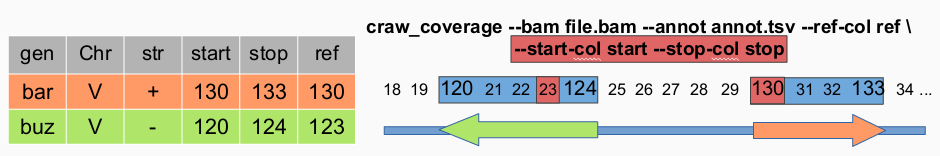
craw_coverage --bam ../WTE1.bam --annot ../annotations.txt --ref-col annotation_start --start-col annotation_start --stop-col annotation_end
This command will compute coverage using WTE1.bam and with annotations.txt file.
The reference position will define by the annotation_start column
The first nucleotide of the window will be define by annotation_start column.
The last nucleotide of the window will be define by annotation_end column.
By default the coverages are aligned using the column col-ref as reference, if each window have not the same size
(see above) the None value is used to padded the coverage matrix.
There is 2 other options which alter this behavior
justify option
When this option is set. craw_coverage get the coverages between the position start and stop and then generate new values
by linear interpolation to have the same number of coverage measure for all genes.
If this option is used with fix window and the window is out the gene (before the first position) only the position from
0 will take in account to generates new values.
craw_coverage --bam ../WTE1.bam --annot ../annotations.txt --ref-col annotation_start --start-col annotation_start --stop-col annotation_end --justify 1000
This command will compute coverage using WTE1.bam and with annotations.txt file. For each gene, 1000 values will be estimated by linear interpolation from the raw coverage values.
sum option
When this option is set, instead of recording the coverage for each nucleotides, craw_coverage compute
the sum of the coverages of the window and report it on the coverage file.:
craw_coverage --bam ../WTE1.bam --annot ../annotations.txt --ref-col annotation_start --start-col annotation_start --stop-col annotation_end --sum
This command will compute coverage using WTE1.bam and with annotations.txt file. For each gene, the sum of all coverages is computed and reported on the coverage file.
Other options
The following option are not mandatory:
-q QUAL_THR, –qual-thr QUAL_THR The minimal quality of read mapping to take it in account. (default=15)
-s SUFFIX, –suffix SUFFIX The name of the suffix to use for the output file. (default= .cov)
-o OUTPUT, –output OUTPUT The path of the output (default= base name of annotation file with –suffix)
–version display version information and quit.
–verbose, -v increase the verbosity of the output (this option can be repeat several times as -vv).
–quiet decrease verbosity of the output. By default craw_coverage is slightly verbose and display a progress bar. This option can be useful to disable any progression information on batch run.
-h –help display the inline help and exit.
Warning
by default craw_coverage use a quality threshold of 15 (like pysam)
Note
strand column mut named strand and can take 1/-1 or +/- for/rev as value for forward/reverse strands.
Warning
the coverage file can be huge depending on the number of gene to compute the coverage and the size of the window for instance for 6000 genes with a window of 15000 nt the cov file will weight almost 900Mb.
craw_htmp
Compute a figure from a file of coverage generated by craw_coverage. By default, display a figure with two heatmap one for the sense the other for the antisense. But it work also if the coverage file contains sense or anti sense data only.
Mandatory arguments
cov_file The path to the coverage file ( the output of ).
Data options
–crop CROP CROP: Crop the matrix. This option need two values the name of the first and last column to keep [start col, stop col] eg –crop -10 1000
craw_htmp --crop 0 2000 WTE1_var_window.cov
This command will display only column ‘0’ to ‘2000’, included, of the matrix generated by craw_coverage.
–sort-using-col COL sort the data using the column name ‘COL’ (descending).
–sort-using-file SORT_USING_FILE sort the rows using a file. The file must have on the first line the name of the column to use for sorting and each line must match to a value contained in the matrix.
–sort-by-gene-size [start_col,stop_col [start_col,stop_col …]] The rows will be sorted by gene size using start_col and stop_col to compute length. start_col and stop_col must be a string separated by comma. If start_col and stop_col are not specify annotation_start,annotation_end will be used.
–sense-only Display only sense matrix (default is display both).
–antisense-only Display only anti sense matrix (default is display both).
Warning
Don’t put the –sort-by-gene-size option without value as last option just before the coverage file. In this case the craw_htmp will don’t work. If you want to use only this option, use the -v option after –sort-by-gene-size
craw_htmp --sort-by-gene-size -v WTE1_0_2000.cov
Figure options
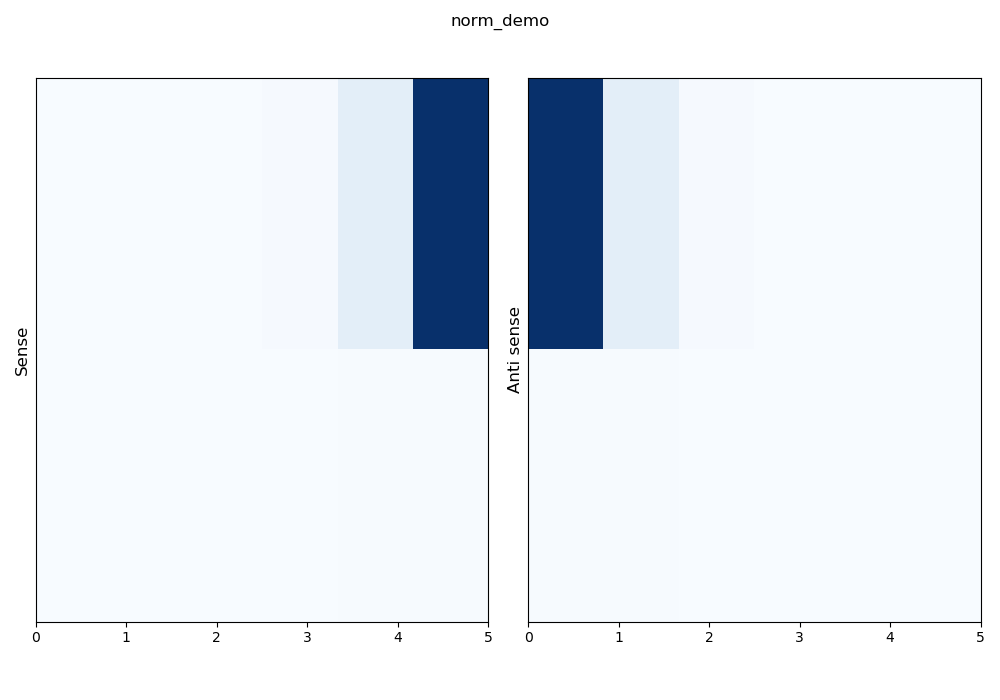
Normalization options
craw_htmp provide several methods to normalize data before to display them: below the different figures illustrate the result of each normalization methods on the following matrix \(x\).
Pos |
0 |
1 |
2 |
3 |
4 |
5 |
|---|---|---|---|---|---|---|
S |
0 |
1 |
10 |
100 |
1000 |
10000 |
AS |
10000 |
1000 |
100 |
10 |
1 |
0 |
S |
1 |
10 |
20 |
30 |
40 |
50 |
AS |
50 |
40 |
30 |
20 |
10 |
1 |
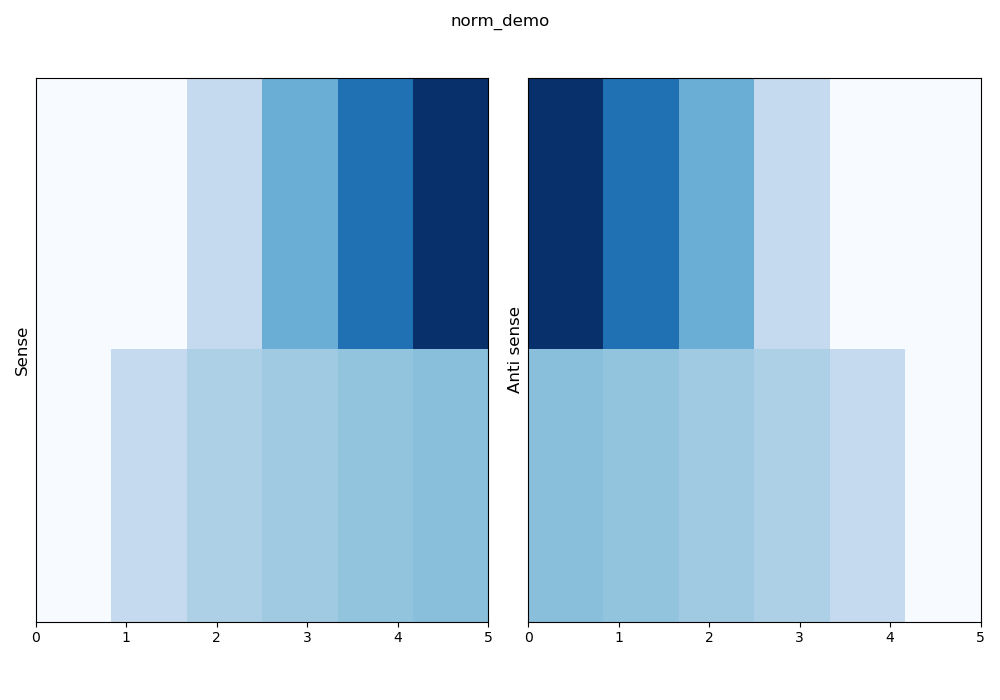
linear normalisation
–norm lin: a linear normalization is applied on the whole matrix.
\(x\) the original matrix
\(x_i\) the value of a cell in the original matrix
\(z_i\) the value of a cell in the normalized matrix
\(z_i = \frac{x_i - min(x)}{max(x) - min(x)}\)

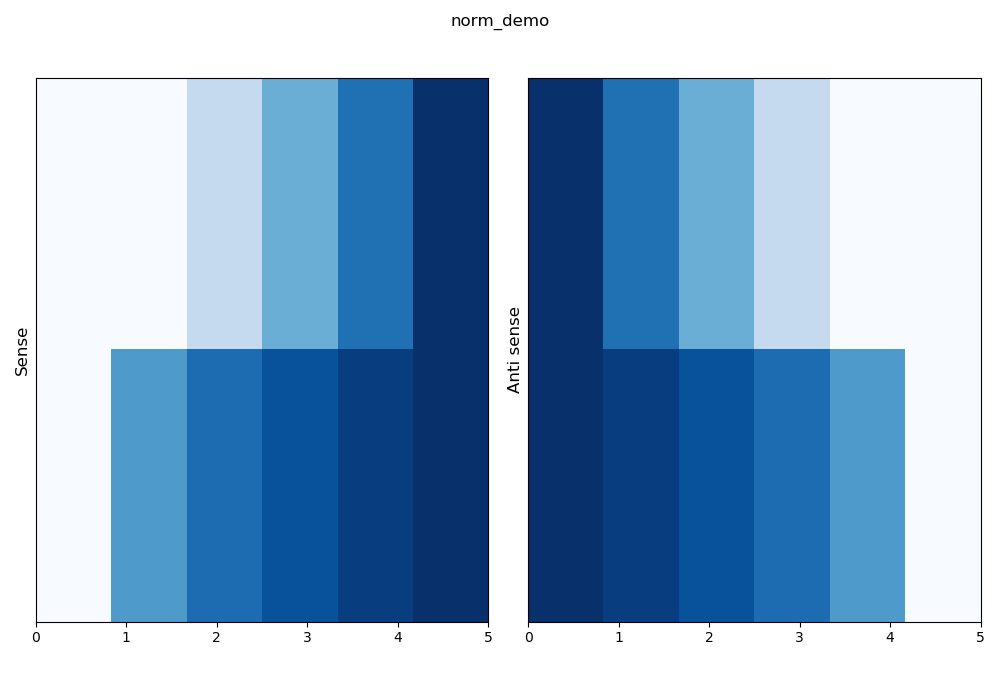
logaritmic normalisation
–norm log: a 10 base logarithm will be applied on the data before matrix normalization.
replace all 0 values by 1
\(z_i = log_{10}(x_i)\)
\(w_i = \frac{z_i - min(z)}{max(z) - min(z)}\)
linear normalisation row by row
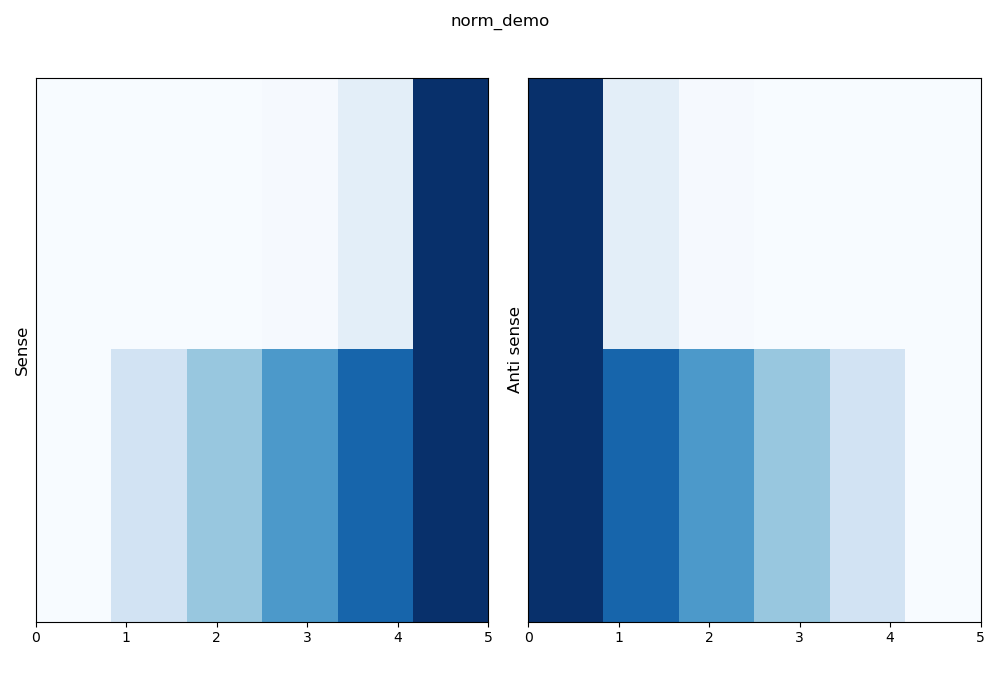
–norm row: mean that a linear normalisation is compute row by row.
\(x\) the original matrix
\(x_{ij}\) the value of a cell in the original matrix with \(I\) rows and \(J\) columns
\(x_i\) the values of the \(i\) row
\(z_{ij} = \frac{x_{ij} - min(x_i)}{max(x_i) - min(x_i)}\)
logaritmic normalisation row by row
–norm log+row mean a 10 base logarithm will be applied before a normalisation row by row.
\(x\) the original matrix
\(x_{ij}\) the value of a cell in the original matrix with \(I\) rows and \(J\) columns
\(x_i\) the values of the \(i\) row
replace all 0 values by 1
\(z_{ij} = log_{10}(x_ij)\)
\(w_{ij} = \frac{z_{ij} - min(z_i)}{max(z_i) - min(z_i)}\)
Note
‘row+log’ is an alias for ‘log+row’
The default normalisation is lin
Other figure options
–cmap CMAP The color map used to display data. The allowed values are defined in http:matplotlib.org/examples/color/colormaps_reference.html eg: Blues, BuGn, Greens, GnBu, … (default: Blues).
–title TITLE The figure title. It will display on the top of the figure. (default: the name of the coverage file without extension).
–dpi DPI The resolution of the output (default=100).
This option work only if –out option is specified.
To set the right dpi for screen displaying use the matplotlib configuration file.–size SIZE Specify the figure size
The value must be widexheight[unit] or ‘raw’. If value is ‘raw’ it will be produce two image files (for sense and antisense) with one pixel correspond to one coverage value. Otherwise, ‘wide’ and ‘height’ must be positive integers By default unit is in inches. eg:
7x10 or 7x10in for 7 inches wide by 10 inches height.
70x100mm for 70 mm by 100 mm.
default=7x10 or 10x7 depending of the figure orientation (see layout).
–mark POS <COLOR> will draw a vertical line at the position POS with the color <COLOR>
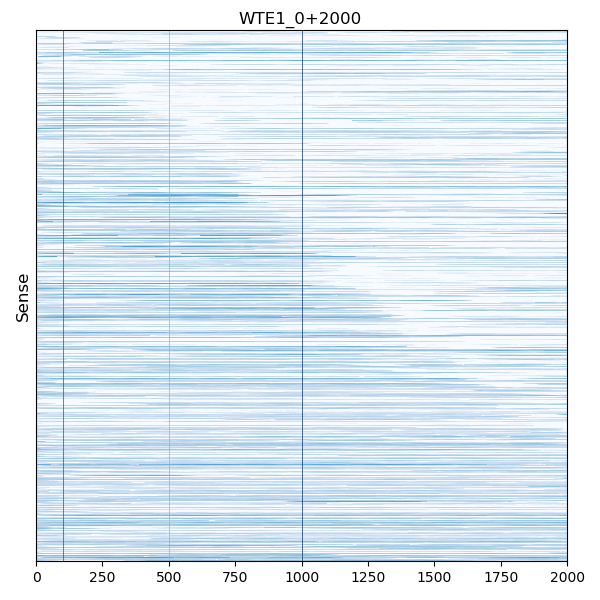
COLOR can be the name of the most common html color red, yellow, … or a value of a RGB in hexadecimal format like #rgb or #rrggbb for instance #ff0000 represent pure red. (don’t forget to surround the hexadecimal color with quotes on commandline)
If COLOR is omitted the color of the highest value of the color map used for the drawing will be used (The default color map is Blues).
craw_htmp --norm log --mark 1000 --mark 500 MediumAquamarine --mark 100 "#ff0000" --sense-only WTE1_0+2000.cov
for list of HTML colors:
Warning
The –mark option must not be the last option on the command line (just before the coverage file), otherwise an error will occurred.:
craw_htmp --out my_fig.png --mark 10 red --mark 0  WTE1_0_2000.cov => raise an error
craw_htmp --mark 10 red --mark 0 --out my_fig.png WTE1_0_2000.cov => work
Layout options
–sense-on-left Where to display the sense matrix relative to antisense matrix.
–sense-on-right Where to display the sense matrix relative to antisense matrix.
–sense-on-top Where to display the sense matrix relative to antisense matrix.
–sense-on-bottom Where to display the sense matrix relative to antisense matrix.
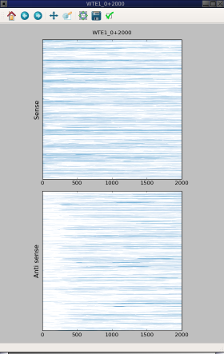
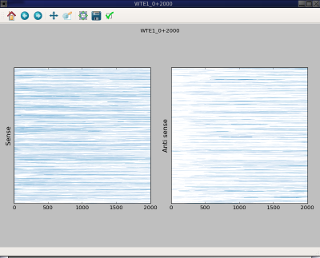
The fisrt screen capture use –sense-on-top whereas the second capture used –sense-on-left option.
Note
default is top.
Other options
-h, –help Display the help message and exit
–out OUT The name of the file (the format will based on the extension) to save the figure. Instead of displaying the figure on the screen, save it directly in this file.
-v, –verbose Increase output verbosity. By default craw_htmp is relatively quiet (display only warning and error), if you want to display also the processing step just add -v on the commandline (or -vv to display also the debugging message).
–version Display version information and quit.